Occupations on the map
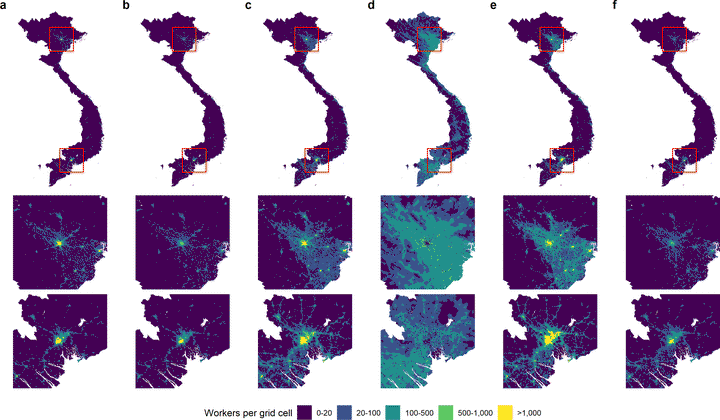
Detailed and accurate labor statistics are fundamental to support social policies that aim to improve the match between labor supply and demand, and support the creation of jobs. Despite overwhelming evidence that labor activities are distributed unevenly across space, detailed statistics on the geographical distribution of labor and work are not readily available. To fill this gap, we demonstrated an approach to create fine-scale gridded occupation maps by means of downscaling district-level labor statistics informed by remote sensing and other spatial information. We applied a super-learner algorithm that combined the results of different machine learning models to predict the shares of six major occupation categories and the labor force participation rate at a resolution of 30 arc seconds (~1x1 km) in Vietnam. The results were subsequently combined with gridded information on the working-age population to produce maps of the number of workers per occupation. The proposed approach can also be applied to produce maps of other (labor) statistics, which are only available at aggregated levels. The results have been published here.